Sharpen photos and correct exposures with the histogram
You have probably been there before. You are standing outside on a brilliant, sunny day, capturing what you think is the perfect landscape. You look at the small screen on the back of your digital camera, and the image looks fantastic. But later, when you load that same image onto your computer at home, you realize it is either far too dark or completely washed out. The camera screen lied to you, or rather, the bright sunlight outdoor environment tricked your eyes.
Relying on your camera LCD screen to judge exposure is one of the easiest ways to ruin a great photo. The screen brightness changes depending on your surroundings, and it is simply too small to show fine details in light and shadow. Fortunately, your camera has a built-in tool designed specifically to solve this problem. It is called the histogram.
While this little graph can look intimidating at first glance, it is actually incredibly simple to read once you know what you are looking at. Think of it as a reliable, mathematical representation of the light in your scene. Let us break down how to read a histogram, how to use it in the field, and why it will completely change the way you manage your exposures.
What is a Histogram?
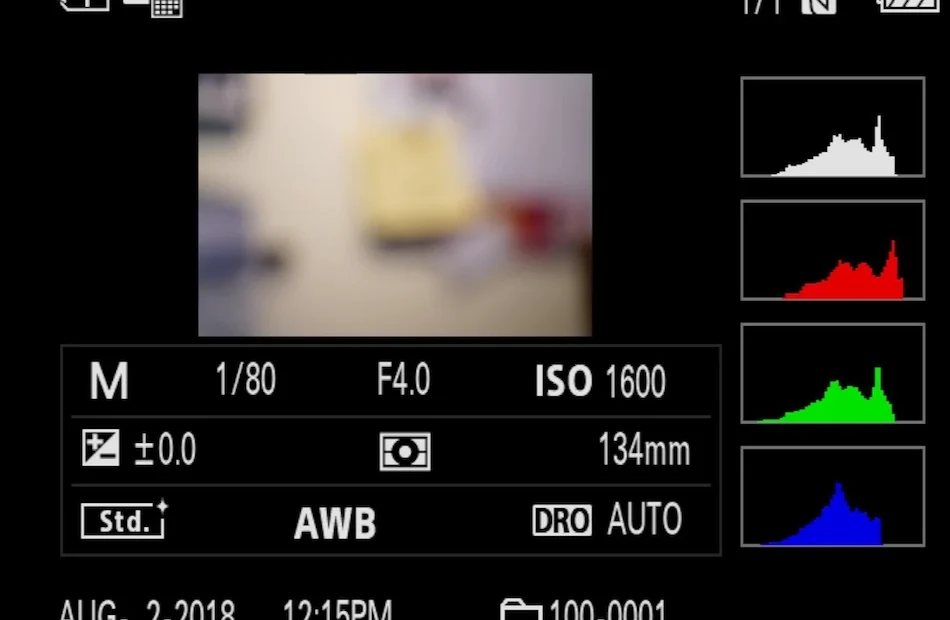
At its core, a histogram is a simple bar chart that shows the tonal distribution of the pixels in your image. It displays how many pixels of a certain brightness level exist in your photo, ranging from pure black on one side to pure white on the other.
When you look at the graph, the horizontal axis represents the brightness scale. The vertical axis shows the volume of pixels at each specific brightness level. A tall peak means you have a large number of pixels at that particular brightness. A flat line or a gap means there are very few or no pixels of that tone in your image.
The beauty of the histogram is its objectivity. It does not care if you are standing in direct sunlight or a dark closet. It simply counts the pixels and tells you the truth about your exposure.
Reading the Graph from Left to Right
To make sense of the histogram, it helps to divide the horizontal axis into five distinct zones, moving from the darkest tones on the left to the brightest tones on the right.
The Far Left: Blacks
The absolute left edge of the graph represents pure black. If the graph touches or spikes against this left wall, it means parts of your image are completely black, containing no detail or texture at all. This is often referred to as shadow clipping or crushed shadows.
The Left-Center: Shadows
Just to the right of pure black is the shadow region. This area contains the dark details of your image, such as dark clothing, deep foliage, or the shaded side of a building. You want details here to be visible rather than lost in total darkness.
The Middle: Midtones
The middle third of the histogram represents the midtones. This is where the majority of everyday tones live, including average skin tones, green grass, blue sky, and grey pavement. In a balanced scene, a large portion of your graph will often cluster in this central area.
The Right-Center: Highlights
Moving further right, we reach the highlights. This zone contains the bright parts of your image that still retain detail, such as soft clouds, light skin tones, or a white shirt. Keeping these areas in this zone ensures they do not become too bright.
The Far Right: Whites
The absolute right edge represents pure white. If your graph spikes against this right wall, it means parts of your image are completely blown out. There is no color or detail in these pixels; they are simply solid white. This is known as highlight clipping.
The Danger of Clipping
Understanding clipping is the most important part of using a histogram. When data spills over the left or right edges of the graph, that visual information is permanently lost.
If you clip your highlights on the right edge, those areas become blank white patches. If you try to darken them later in editing software, they will simply turn a flat, muddy grey because there is no underlying detail to recover. This is a common issue when shooting bright skies, water reflections, or white wedding dresses.
Shadow clipping on the left edge means your dark areas are solid black. While modern camera sensors are incredibly good at recovering shadow detail when you shoot in RAW format, pushing extremely dark shadows too far in editing will introduce a massive amount of digital noise and grain.
As a general rule, it is usually safer to protect your highlights. It is much easier to pull detail out of dark shadows during post-processing than it is to recreate detail in a blown-out, pure white sky.
The Myth of the Perfect Histogram
A common misconception among developing photographers is that a good histogram must look like a perfect bell curve, with a neat hill in the center and tapering edges on both sides. This is simply not true.
There is no such thing as a single perfect histogram shape. The shape of the graph depends entirely on the subject matter and the creative look you want to achieve. Let us look at a few examples of how different scenes naturally produce very different histograms.
- A snowy landscape: If you are photographing a snow-covered field on an overcast day, your image will be naturally very bright. Your histogram should be heavily weighted to the right side of the graph. If the graph were centered, your snow would look like a dull, unattractive grey instead of bright white.
- A campfire portrait: If you are taking a photo of someone sitting by a campfire at night, the background will be pitch black, and only one side of their face will be lit by the warm glow. Your histogram will have a massive spike on the far-left side representing the dark night sky, and a small bump in the middle or right representing the illuminated face. This is correct for the mood of the scene.
- A high-contrast forest: If you are shooting inside a forest on a sunny day, you will have very bright sunlight filtering through the leaves and very dark shadows under the trees. This will often produce a U-shaped histogram, with peaks on both the left and right sides and very little in the middle.
Instead of looking for a specific shape, use the histogram to verify that you are not accidentally losing details that you actually want to keep.
How to Use the Histogram While Shooting
Now that you know how to read the graph, it is time to put it to work. Most modern mirrorless cameras allow you to view a live histogram right inside the electronic viewfinder or on the LCD screen before you even take the picture. If you shoot with a DSLR, you can easily enable the histogram display when reviewing your captured images.
When you are setting up your shot, take a quick look at the graph. If you notice the curve is crashing into the right wall, your image is likely overexposed. You can correct this by shortening your shutter speed, closing down your aperture to a higher f-number, lowering your ISO, or using your exposure compensation dial to dial in a negative value.
Conversely, if the entire graph is huddled against the left wall, your image is underexposed. You can fix this by slowing down your shutter speed, opening your aperture, raising your ISO, or using positive exposure compensation.
Many advanced photographers use a technique called exposing to the right. This involves making the image as bright as possible without clipping any highlights, pushing the histogram curve as far to the right as it can safely go. This captures the maximum amount of light and data, resulting in incredibly clean, noise-free images once you adjust the exposure back to normal in your editing software.
What to do Next in the Field
The next time you head out with your camera, make a conscious effort to ignore how pretty the image looks on your screen. Instead, press the info or display button on your camera until the histogram pops up. Take a few test shots of a high-contrast scene, such as a sunset or a dark street corner under a bright streetlamp, and watch how the graph shifts as you change your exposure settings.
By learning to trust this simple tool over your own eyes in bright light, you will save yourself countless hours of frustration at your computer later. Have you ever lost a great shot to bad exposure because you trusted your camera screen? Take a look through your camera settings today, turn on that histogram, and see how it changes your shooting workflow.