How to Read Your Camera’s Histogram
Your camera’s LCD screen lies to you. Not on purpose, but between the brightness of your surroundings, the screen’s own calibration, and how your eyes adjust to different lighting, what looks like a perfectly exposed shot outdoors can turn out to be a muddy mess once you open it on a real monitor. This is exactly why the histogram exists, and why learning to read it is one of the most useful things you can do to improve your photography.
A lot of photographers ignore this little graph because it looks technical and intimidating. It’s not. Once you understand what it’s telling you, it becomes faster to read than squinting at a tiny preview image, and far more reliable.
What a Histogram Actually Is
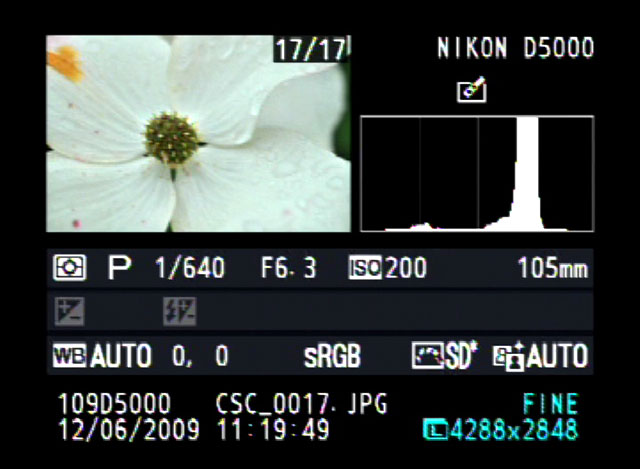
A histogram is a graph that shows the distribution of brightness values in your image. Think of it as a bar chart with 256 possible positions along the horizontal axis, from pure black on the left (value 0) to pure white on the right (value 255). The vertical axis shows how many pixels in your photo fall at each brightness level.
That’s genuinely all it is. No color theory, no complicated math you need to do yourself. The camera or editing software builds this chart for you automatically every time you take or open a photo.
Here’s the part that trips people up: a histogram doesn’t tell you if a photo is good. It tells you how the tones are distributed. A photo of a black cat in a coal cellar will have a histogram bunched up on the left, and that’s correct, not a problem to fix. A photo of a polar bear in snow will lean heavily right, and that’s also correct. Context matters more than any “ideal” shape.
Reading the Shape of the Graph
When you look at a histogram, you’re really looking for a few things:
- Where the bulk of the data sits — left, right, or spread through the middle
- Whether data is being cut off at either edge — this is called clipping
- How wide or narrow the spread is — narrow usually means lower contrast, wide usually means higher contrast
Shadows, Midtones, and Highlights
The horizontal axis splits roughly into three zones:
- Shadows — the left third, representing dark tones
- Midtones — the middle third, where most of the visual information in a typical scene lives
- Highlights — the right third, representing bright tones
A well-exposed daytime portrait, for example, usually shows a strong peak somewhere in the midtones, with smaller amounts trailing into the shadows and highlights. But again, this is a general pattern, not a rule you need to force onto every image.
Clipping: The Thing You Actually Need to Watch
Clipping happens when detail gets pushed so far to one edge of the histogram that it piles up against the wall and simply stops. Once a pixel hits pure white (255) or pure black (0), there’s no more information there. It’s gone. You can’t recover detail that was never recorded.
This is the single most practical reason to check your histogram in the field. Highlight clipping in particular is often unrecoverable, especially with JPEG files, and even RAW files have limits.
How to Spot Clipping
Look at the far left and far right edges of the histogram. If you see a spike climbing straight up against either wall, that’s clipped data. A little clipping on a small light source, like the sun itself or a bright reflection off chrome, is usually fine and unavoidable. A big spike covering a large portion of your image, like blown-out sky or a whited-out wedding dress with zero texture left, is a real problem.
Many cameras also offer a highlight warning feature during image playback, often called “blinkies.” These make clipped highlight areas flash on your screen. It’s worth turning this on if your camera supports it, since it’s a faster way to catch the problem than staring at the histogram alone.
Why the Screen Preview Fools You
Here’s a scenario that happens to nearly every photographer at some point. You’re shooting outdoors on a bright sunny day. You check your LCD, the image looks properly exposed, maybe even a touch dark. You keep shooting. Later, at home, you discover half your shots have blown-out skies you never noticed.
The problem wasn’t your exposure. It was that bright ambient light made your screen appear dimmer by comparison, tricking your eyes into thinking the image was darker than it actually was. The histogram doesn’t care about ambient light. The data is the data, regardless of how bright the room or the outdoors happens to be. This alone is reason enough to build the habit of checking it.
Types of Histograms You’ll Encounter
Luminance Histogram
This is the standard one described above, showing overall brightness without breaking it into color channels. It’s the default view on most cameras and the one most people mean when they say “the histogram.”
RGB Histogram
Some cameras and most editing software let you view separate histograms for red, green, and blue channels. This matters more than people expect. You can have a scene where the luminance histogram looks perfectly fine, but one color channel, say red in a photo full of red flowers, is completely clipped while the others are fine. Checking individual channels catches color-specific clipping that the combined luminance view would miss entirely.
Using Histograms in the Field
Here’s a practical routine worth building into your shooting habits:
- Take a test shot of your scene
- Pull up the histogram on playback
- Check for clipping at either edge
- If highlights are clipping and it’s not intentional, reduce exposure using a faster shutter speed, smaller aperture, or lower ISO
- If shadows are clipping and you need that detail, increase exposure accordingly
- Reshoot the test and recheck
This takes maybe ten seconds once you’re used to it, and it saves you from the sinking feeling of realizing at home that your best shot of the day is unusable.
Exposing to the Right
There’s a technique some photographers use called exposing to the right, often shortened to ETTR. The idea is to push your exposure as far right on the histogram as possible without actually clipping the highlights, because image sensors capture more tonal information in the brighter end of their range than in the shadows.
The practical benefit is that shadow areas end up with less noise when you brighten them later in editing, since you captured more data to work with in the first place. The tradeoff is that ETTR files can look overexposed on the back of the camera, which takes some getting used to, and it only really pays off if you’re shooting RAW, since you need that extra data to pull back down in post-processing. It’s a technique worth experimenting with rather than adopting blindly for every shot.
Histograms in Editing Software
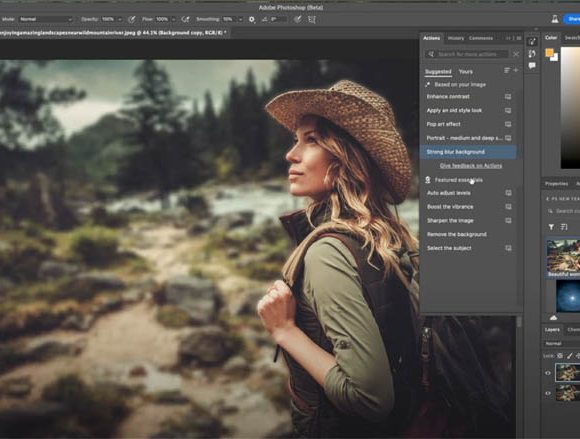
Once you’re editing, the histogram becomes just as useful, if not more so, because now you have full control to fix what you’re seeing. In programs like Lightroom or Capture One, the histogram usually sits in a panel near your exposure sliders and updates live as you adjust them.
This turns editing into a much less guessy process. Instead of dragging the shadows slider around and hoping it looks right on your monitor, you can watch the histogram to confirm you’re not accidentally crushing your blacks or blowing your whites while you work. Some editors even let you click and drag directly on the histogram itself to adjust tonal ranges, which is a fast way to work once you’re comfortable with what each zone controls.
A Quick Editing Checklist
- Check for gaps at the extreme left or right edge — a gap usually means you have room to increase contrast without losing detail
- Watch for sudden spikes at either wall while adjusting exposure or contrast sliders — that’s new clipping you’re introducing
- Compare the RGB channels individually if colors look off, since a shifted or clipped single channel often explains a strange color cast
Common Mistakes Photographers Make
- Chasing a “perfect” bell curve. There’s no universal ideal shape. A histogram that leans heavily left for a night scene or heavily right for a snow scene is often the correct result, not a mistake to correct.
- Ignoring shadow clipping because it seems less obvious. Crushed blacks lose detail just as permanently as blown highlights, and it shows up especially in landscape and product photography where texture in dark areas matters.
- Only checking the combined luminance histogram. This misses single-channel clipping, which is common in photos with strong, saturated colors like sunsets, flowers, or brand logos.
- Never checking it at all. Relying purely on the LCD preview under variable lighting conditions is how usable shots get missed entirely.
Practicing Reading Histograms Without a Camera
If you want to build intuition faster, open any photo editor and load a few different types of images: a bright beach scene, a dim interior, a high-contrast street photo, a flat overcast landscape. Look at each histogram before you look at the image itself, then guess what kind of scene it represents. This exercise trains your eye to connect the graph shape to real-world lighting conditions quickly, so when you’re out shooting, reading the histogram becomes second nature rather than something you have to consciously decode every time.
When to Trust Your Eyes Over the Histogram
The histogram is a tool, not a rulebook. There are legitimate creative choices, like a deliberately silhouetted subject or a high-key portrait with lots of blown white background, where the histogram will show heavy clipping and that’s completely intentional. The goal isn’t to force every photo into a technically “balanced” distribution. It’s to understand what your camera actually captured so any clipping or tonal choices you end up with are ones you chose on purpose, not ones you stumbled into because a bright sky made your LCD lie to you.
Once you’ve shot with histogram checks for a few weeks, you’ll likely find you need to glance at it less often, because you’ll start predicting what it’ll look like before you even press the shutter. That’s the real payoff: not becoming dependent on a graph, but training your eye well enough that the graph mostly just confirms what you already suspected.
Next time you’re out shooting, try pulling up the histogram on a few frames you’d normally judge by eye alone. See what it catches that your screen missed. It’s a small habit, but it’s one of those unglamorous technical skills that quietly makes every other part of your photography better.